Crosstab for dynamic columned report in the Jasper report with JasperSoft Studio Tutorial
We cannot predict the number of records available in a database table. To display it in a jasper report, we have to generate the table dynamically. We use jasper report tables to achieve this. What if we want to generate a table with dynamic columns in the jasper report. With jasper report Crosstab, we can generate both columns and rows dynamically.
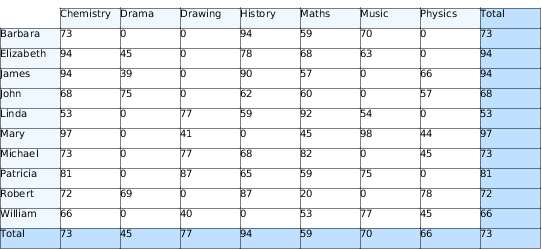
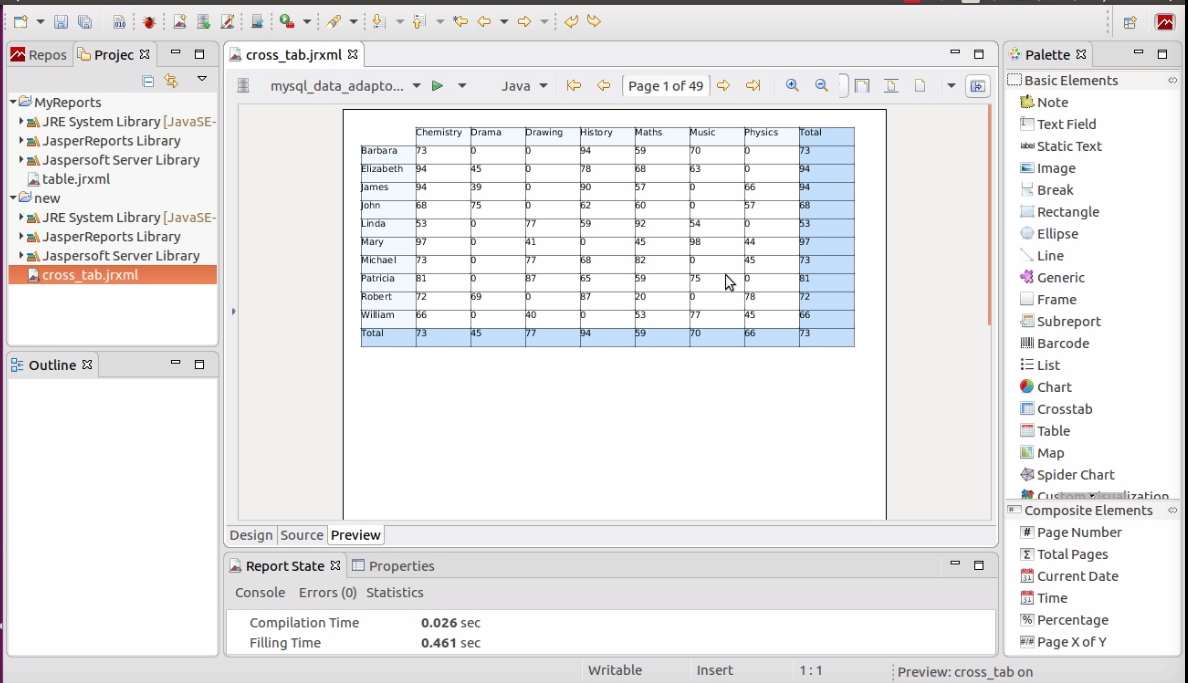
The output of the jasper report Crosstab tutorial
This tutorial we are not going to demonstrate how to create a new jasper report and other basic stuff. You can refer to our previous tutorials for the jasper report.
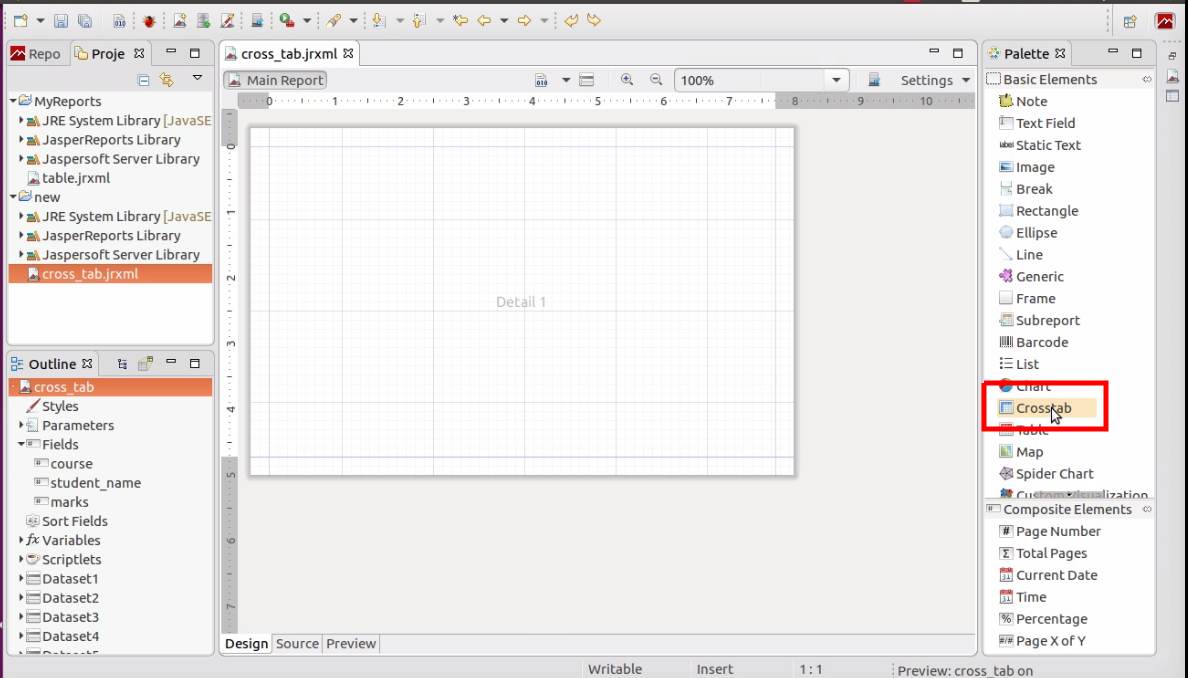
Let's drag and drop jasper report crosstab element into the main report.
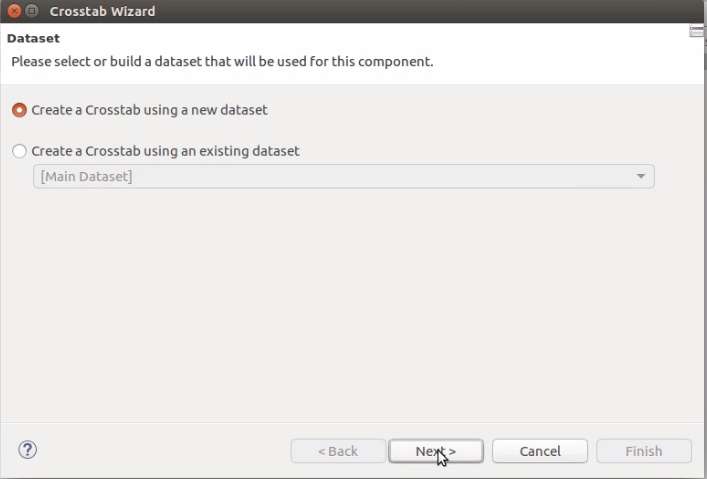
In the popup, We are going to select Create a crosstab using a new dataset. Click next. We are going to keep the default name for the data set, but you can change it.
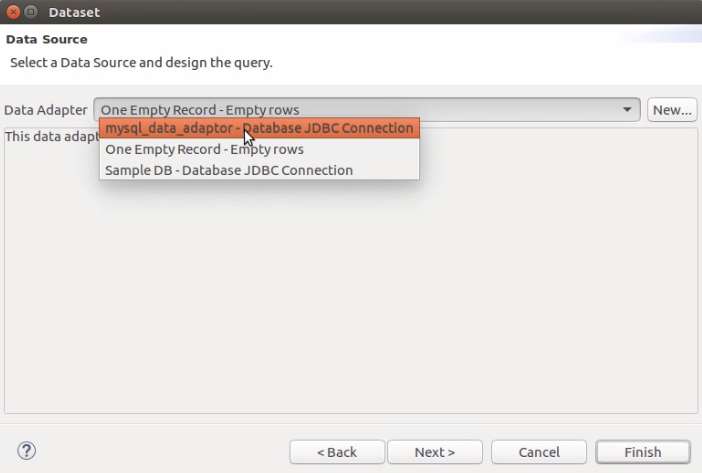
Click Next again. In this screen, I'm going to select musql_data_adaptor, which is already created in my jasper studio.
Next screen, you will see all available databases in our jasper report data adapter. In this screen, you can select the required tables under a database.
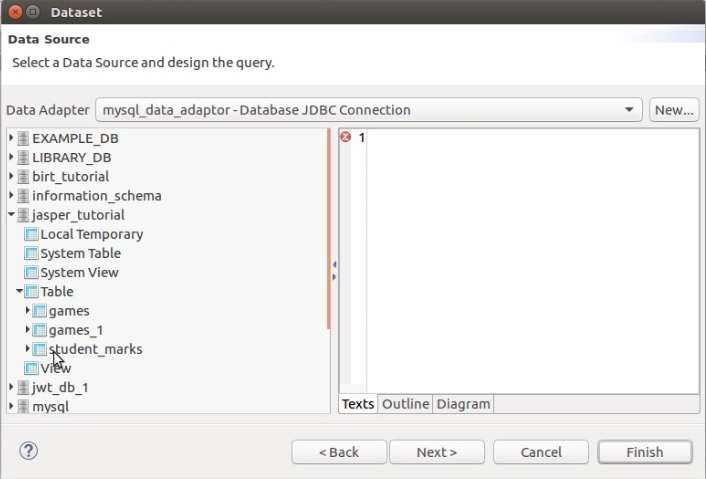
Select the diagram tab on the right side of the screen and drag and drop your table into it. Before click Next, select the fields that you want to continue with.

Next screen, select all the fields.

Crosstab data structure is similar to a Map data structure. Each cell is mapped to a column and a row. You can consider columns and the row as 2 ids to uniquely identify a cell.
Click Next 2 times. You will see the below screen. Here you can select the data member that use to generate columns of the jasper report crosstab.

In the next screen, you need to select a data member to use as a row id. Here i'm selecting student name field.

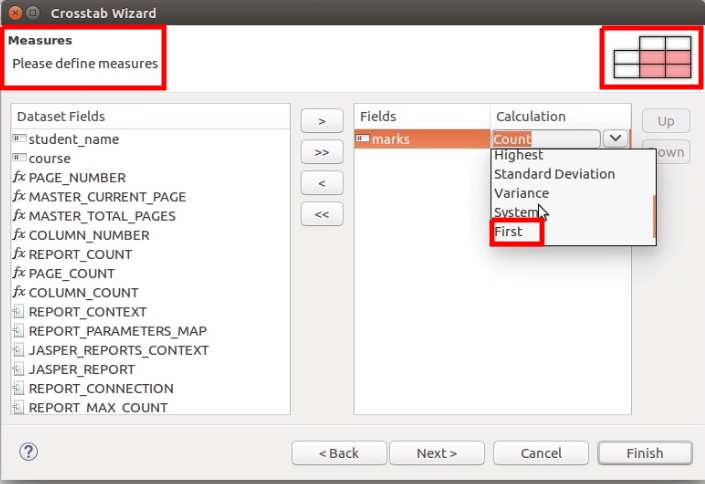
In the next screen, you need to select a data member for measures. For each measure, you can have an aggregate method. I'm not going to select any aggregate calculations here. So I will select the First option.
In the next screen, you can change the colors and other styles. Click Finish.
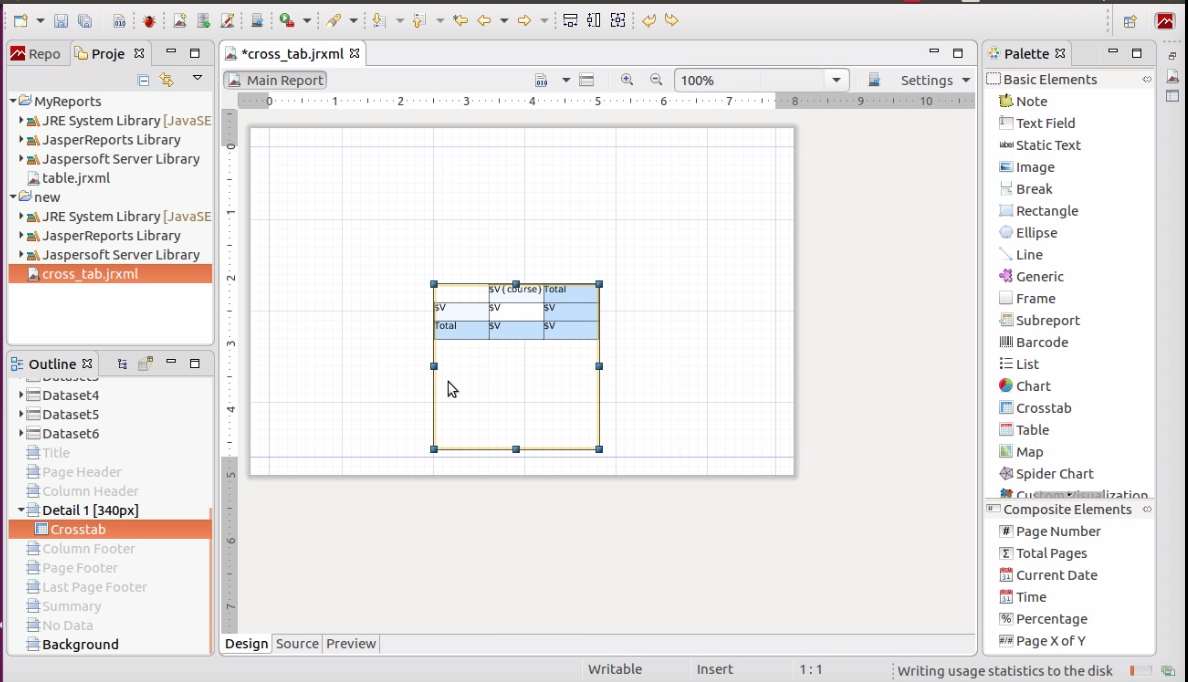
Adjust the size and place of the jasper report crosstab. After that its ready to preview. Click on the preview. Then, you can see the output of jasper crosstab.

We have created our first jasper report example about the jasper report crosstab element.
Check out our video. for the more information up to now.
How to set a default value to a jasper report crosstab cell with null value
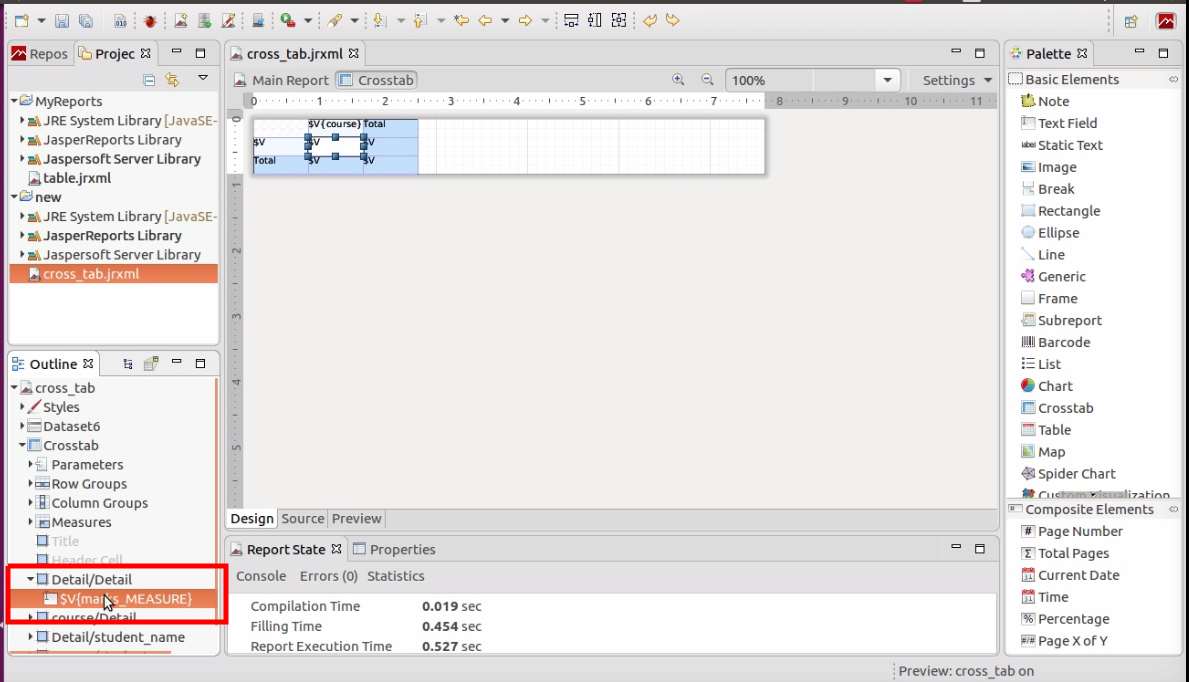
Click on the detail element on the Outline Palette as below.
Go to the properties of the element. Under Text Field properties, you can configure what to do with null values.
By selecting "Blank When NULL" option, you can set your nullable cells to blank.
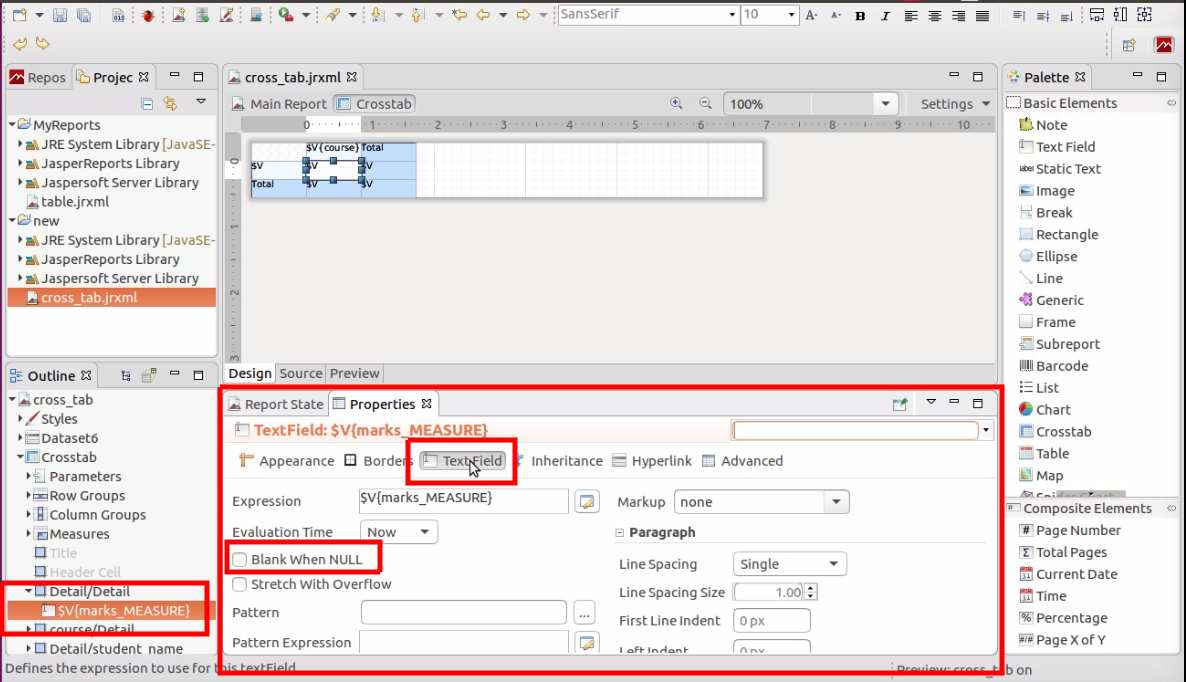
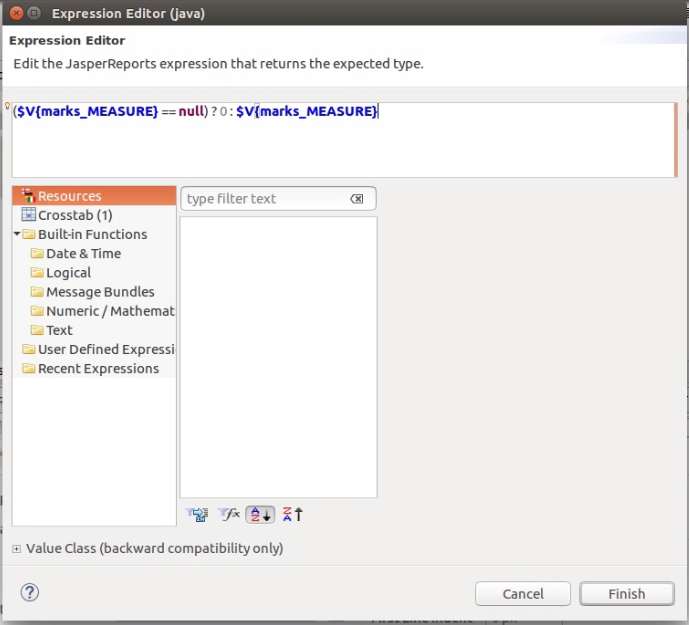
You can do more customizable data manipulation from the "Expression" option. Click on the Expression button.

In the jasper report expression editor, you can write custom code to manipulate jasper report crosstab cell data.
Now you are almost ready. Click on the preview tab and preview the final results of the jasper report crosstab after setting a default value for the null cells.
For more information, check out our video.