BIRT report Crosstab element for generating dynamic columned reports Tutorial
We cannot predict the number of records available in a database table. To display it in a BIRT report, we have to generate the table dynamically. We use BIRT report tables to achieve this. What if we want to generate a table with dynamic columns in the BIRT report. With BIRT report Crosstab, we can generate both columns and rows dynamically.
What is a Crosstab ?
A crosstab presents data in a matrix format and summarizes in a compact format. It displays data by aggregating the column and row. The cross tab can groups column and the row by sum, max, min, first, etc.
The output of the BIRT report Crosstab tutorial

The initial data set for the BIRT report Crosstab tutorial

You can download sample data set here
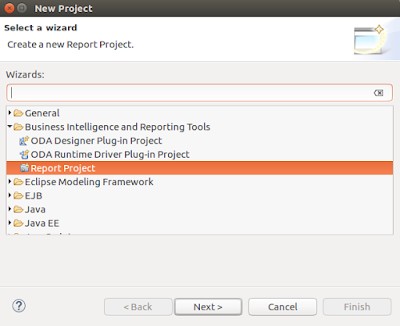
Let's create a BIRT report project first. Click on the File > New > Project > Report Project. Here we name it as Brit-Tutorial.
To create a report design file, click on the File > New > Report. Here we named it cross-tab.rptdesign and choose a blank report template to start the project.


Creating data source for BIRT crosstab report
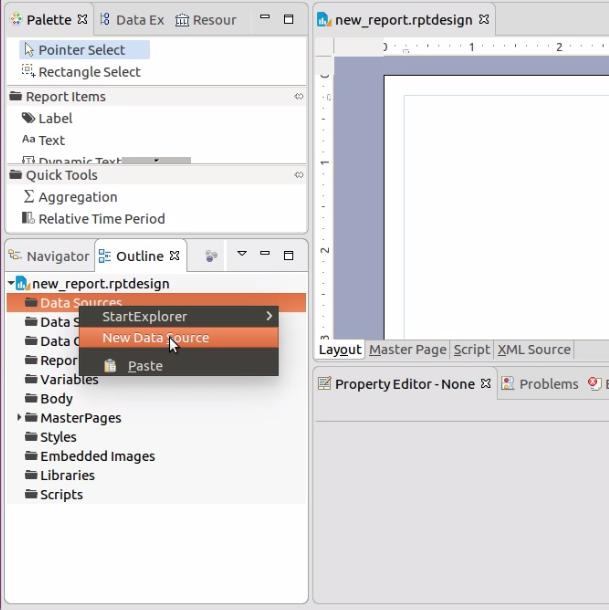
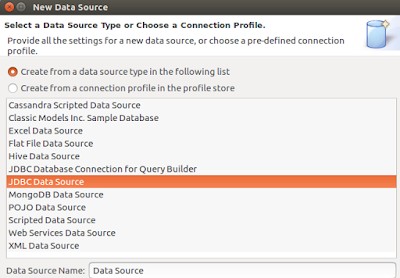
Go to the Outline palette and right-click on the Data Sources, then click New Data Source. Here we choose JDBC Data Source and click Next.
Then on the next screen, we have to provide the database properties like connection information.

Creating data set for BIRT report crosstab sample project
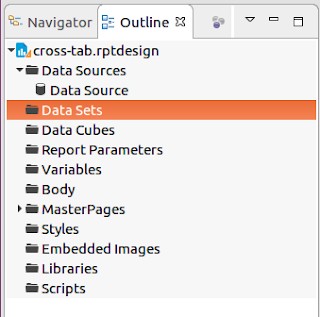
In the Outline palette, you can find a place for Data Sets. Right-click on the Data Sets, and choose New Data Set.

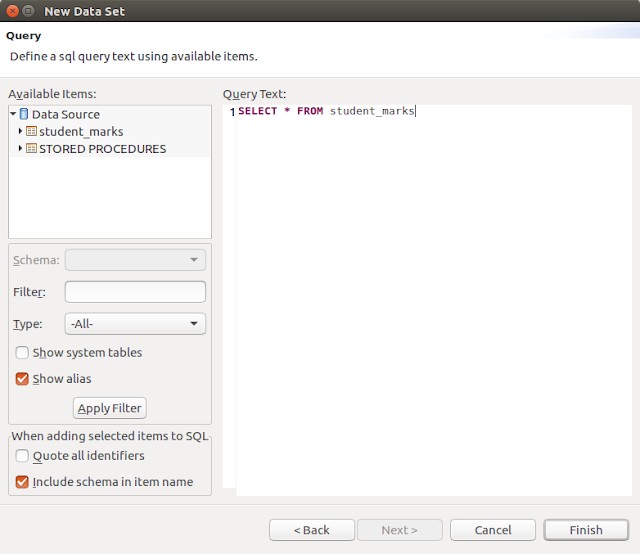
In the next screen, we can provide a SQL query to extract data from the database.
In the next screen, you can preview the data set extract from the database.


What is BIRT report crosstab data cube ?
A data cube is a multidimensional data structure(can be considered as a multidimensional matrix). We can use a data cube to analyze a large data set. BIRT crosstab data cube is a 2 dimension data structure.
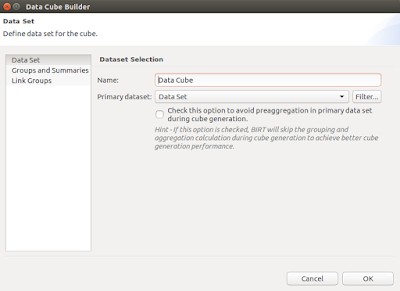
Creating a BIRT report data cube
Right-click on the Data Cubes option. You can find this in the Outline palette. Choose New Data Cube.

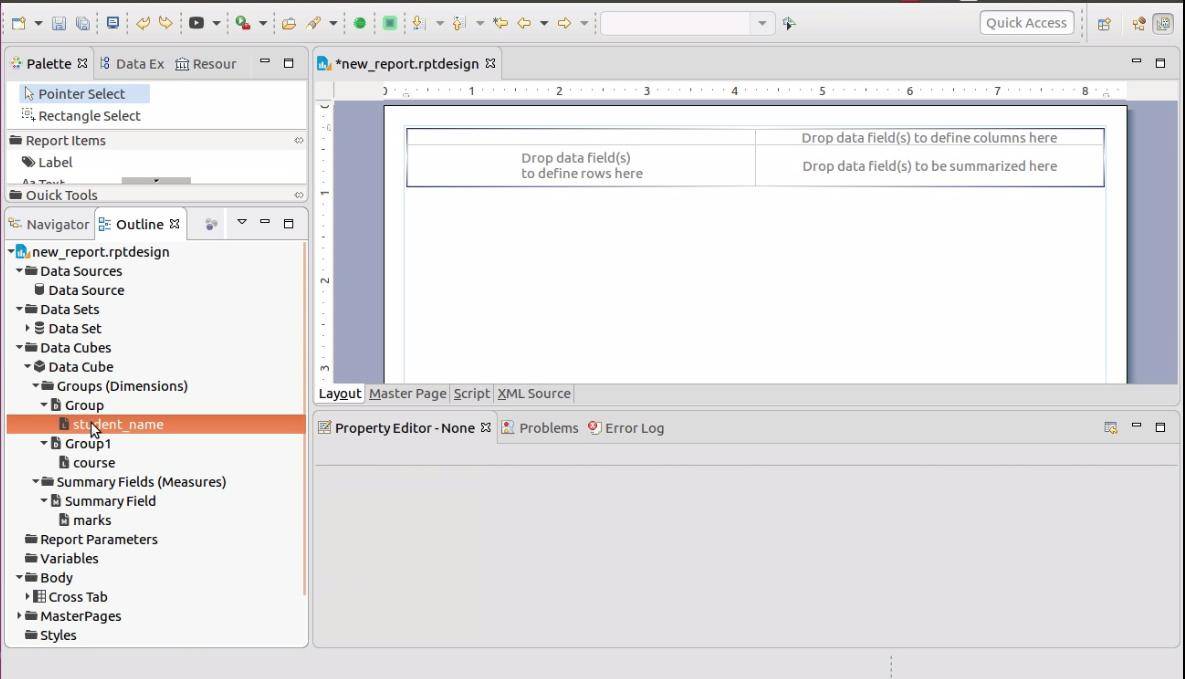
Creating a BIRT report Data Groups and Summaries
Click on the Groups and Summaries link on the next screen. You will see the Available Fields area and the Groups and Summaries field on the right side of the screen.

BIRT report crosstab Data Groups
A data group or a dimension defines the cross tab’s row headings or column headings data. In this example, we define the student name field and the course field as data groups. It will use to generate the dynamic column and row headings.
BIRT report crosstab Summary Fields
A summary field or a measure defines the elements of the crosstab(similar to the matrix elements). We can define an aggregate function for the summary field so that crosstab will respect to the function when generating the report. Here we use marks as a summary field.
Drag and drop your fields into the Data Groups and summary field according to your requirement.

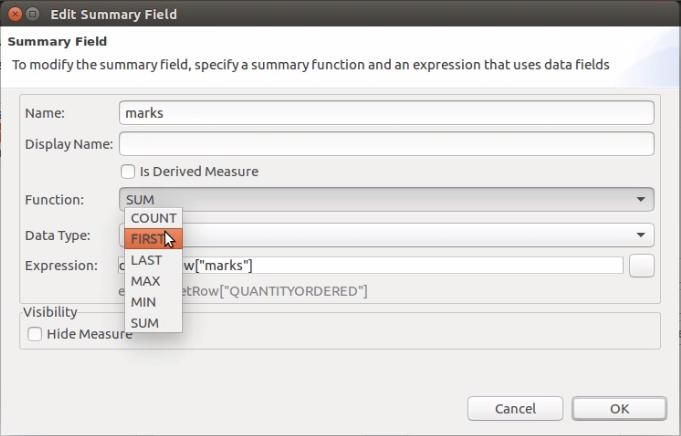
By default, the summary field will be assigned with a SUM aggregate function. So it will sum up all the matching elements by row and the column(Here student name and the course).
Here we have unique values for all the subjects of the each student. So here we are going to use the FIRST function. To change that, we have to edit the marks summary field. Select the summary field. Then double click on the marks summary field or click Edit. The new pop up window has an option to choose the aggregate function you need.
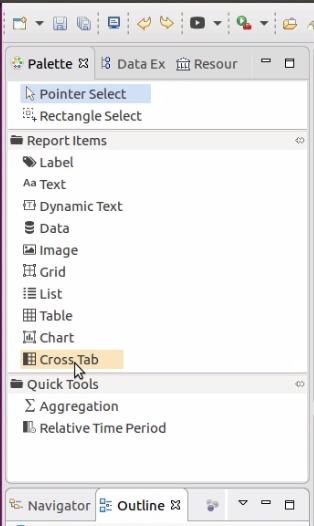
Adding a BIRT crosstab element into the report
Go to the palette and check for the Crosstab element. Then drag and drop the crosstab element from the palette to the report.

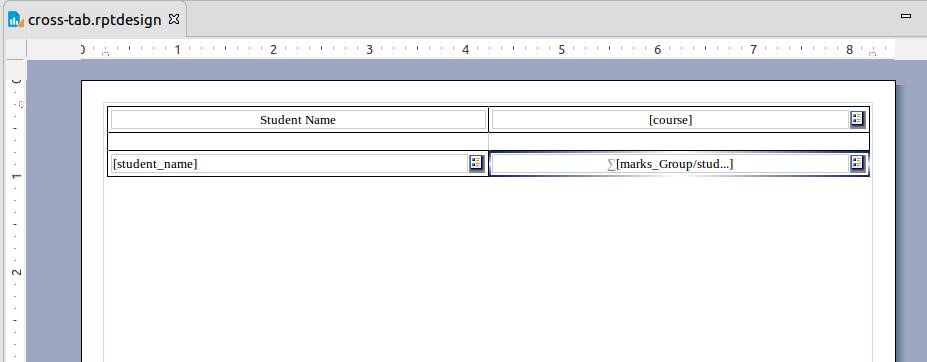
Binding Data Cube data with the BIRT report design file
Drag Data Groups and Summaries as bellow image. Change the crosstab row and column header label as you preferred. That's it. Your data has linked to the design file.
Creating a BIRT report data cube
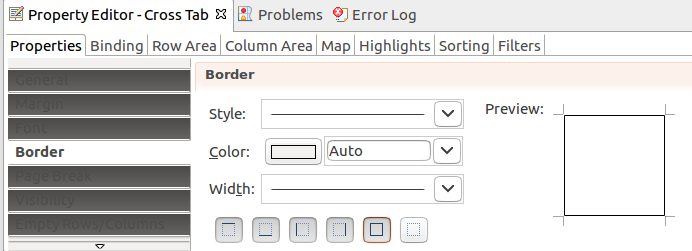
You can add borders and text styles from the property editor in the editor.

Lets preview the report.

That is all about the Birt crosstab dynamic columned report tutorial. You can download the whole project from here.
For more information, check out our video.