BIRT crosstab apply color to alternate rows of a crosstab tutorial
In our previous article, we have discussed how to use the BIRT crosstab element. In this article, we are going to discuss how to apply a color to alternate rows of a BIRT crosstab report.
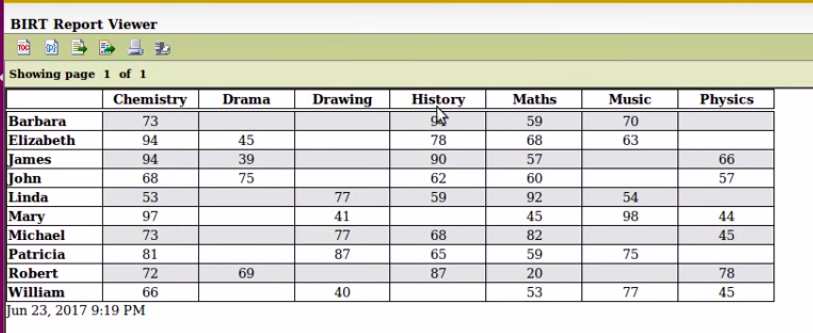
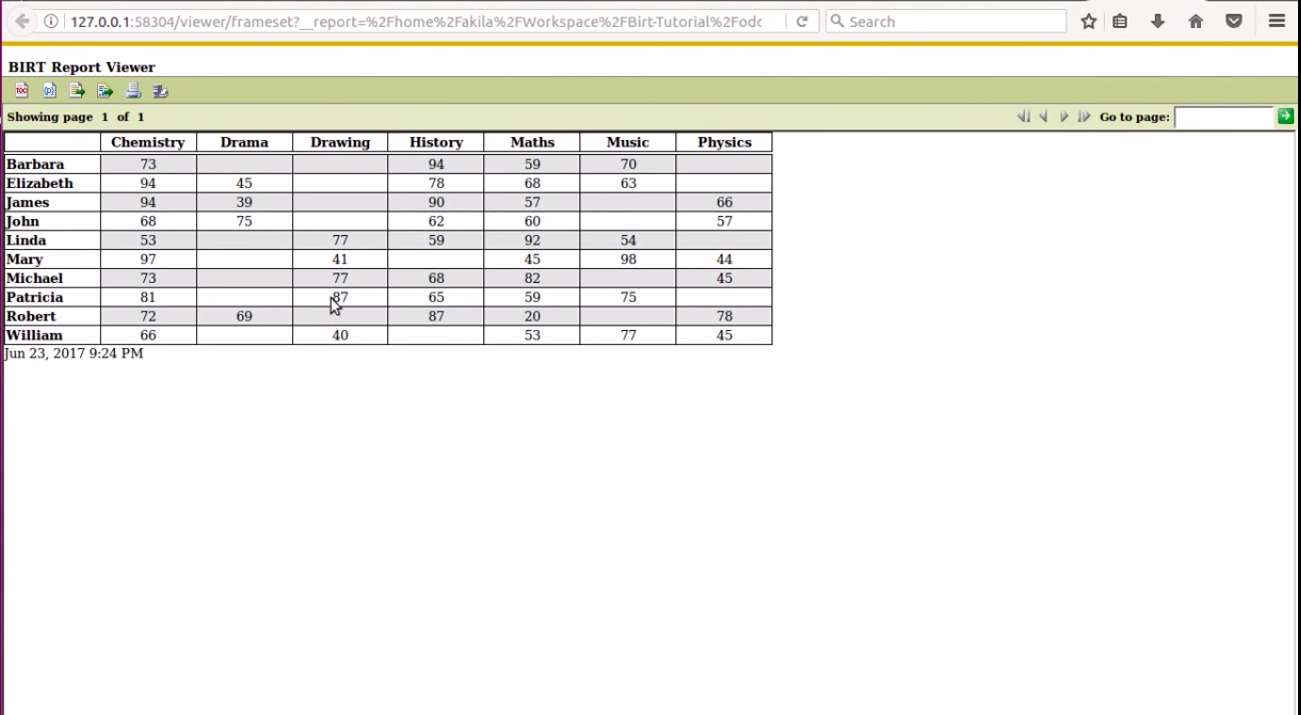
The output of the BIRT Crosstab report after coloring alternate rows
We are going to start this exercise with the BIRT report crosstab design file that we create in our previous article.
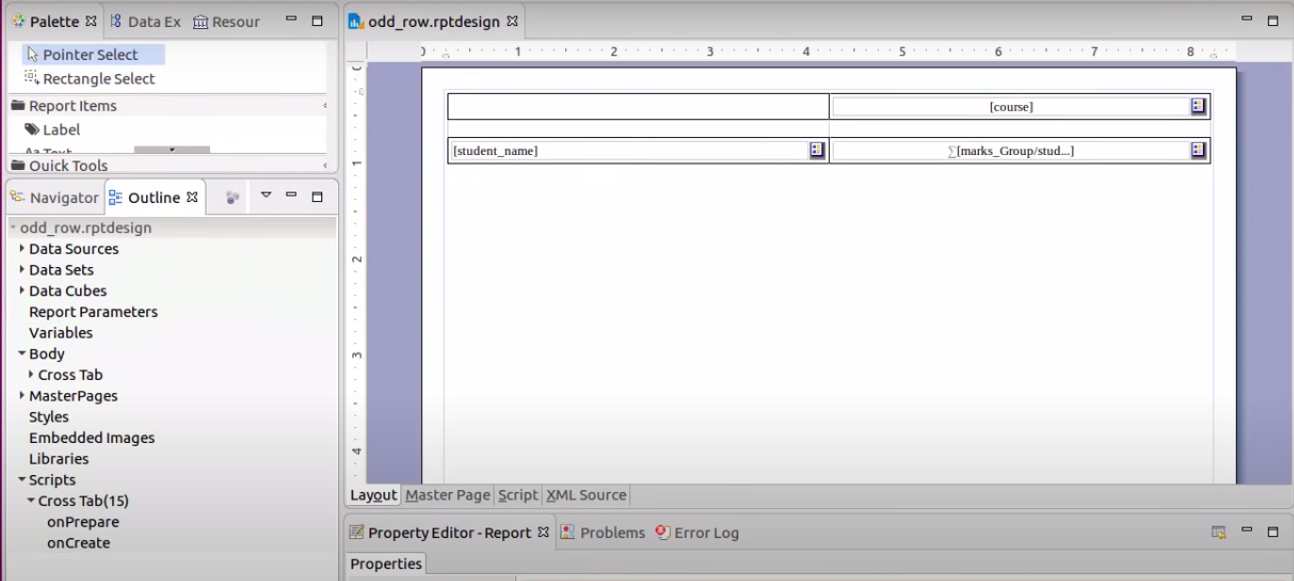
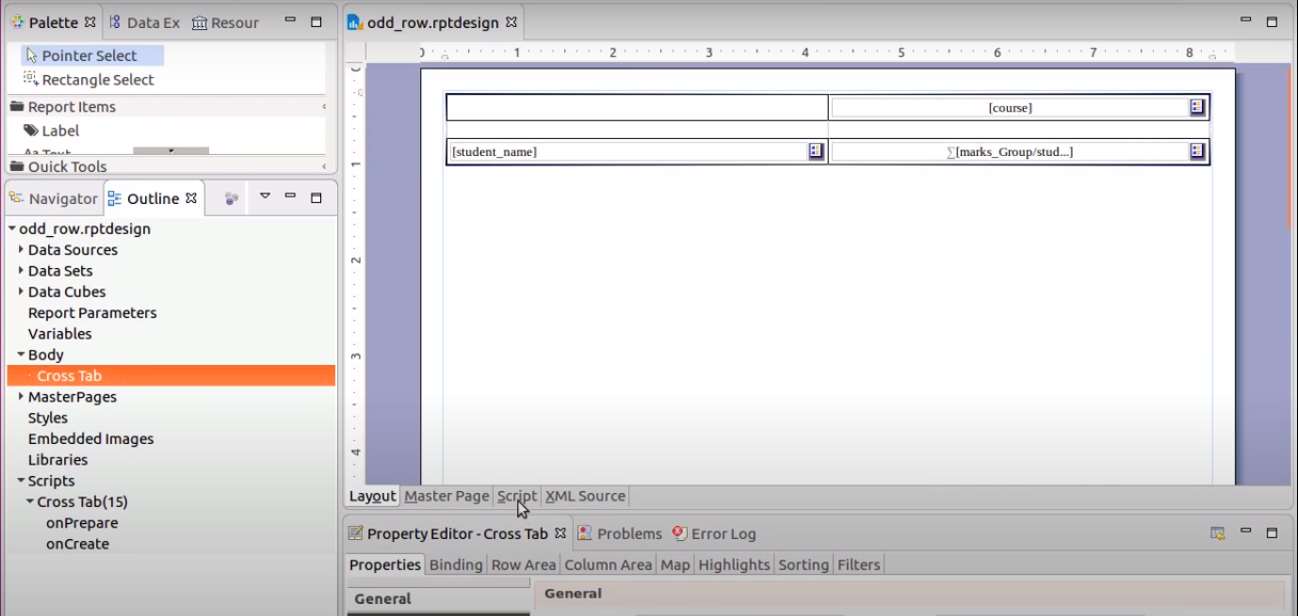
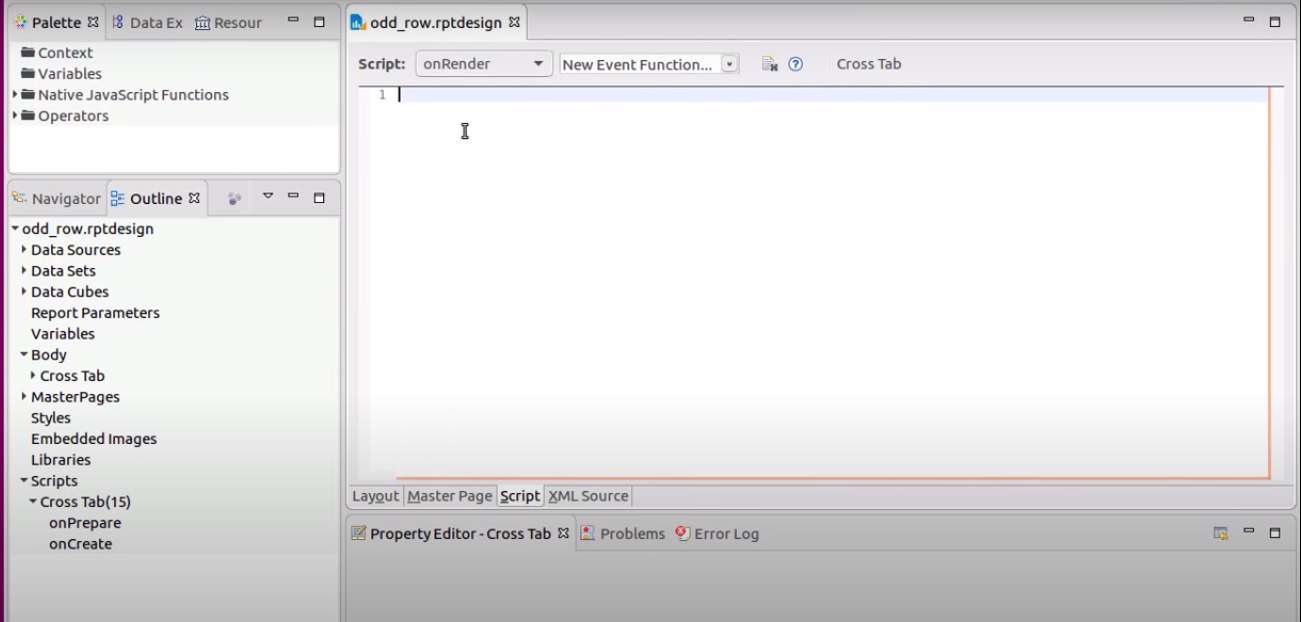
Go to the Outline palette and click on the crosstab element that we already created.
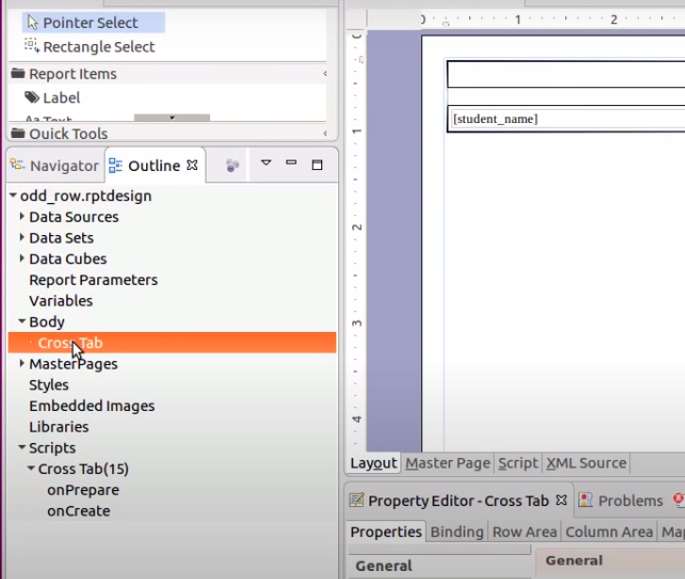
Click on the Script tab.
We are going to change the color of each column by writing custom logic. The script will decide the color of each row.
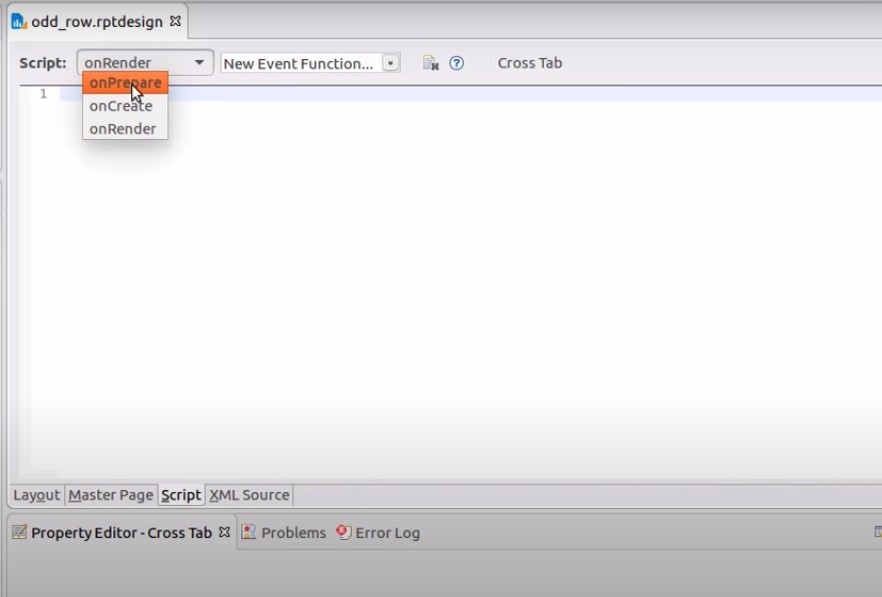
We can write 3 different types of scripts for manipulating BIRT reports, depending on the different stages of the report generation.
- onPrepare
- onCreate
- onRender
You can create global variables, write scripts to manipulate report data, and the global variables each stage.
For this example, we are going to create a global variable and increment the variable when creating each row of the BIRT crosstab. Then row by row, we are going to change the color of the BIRT crosstab.
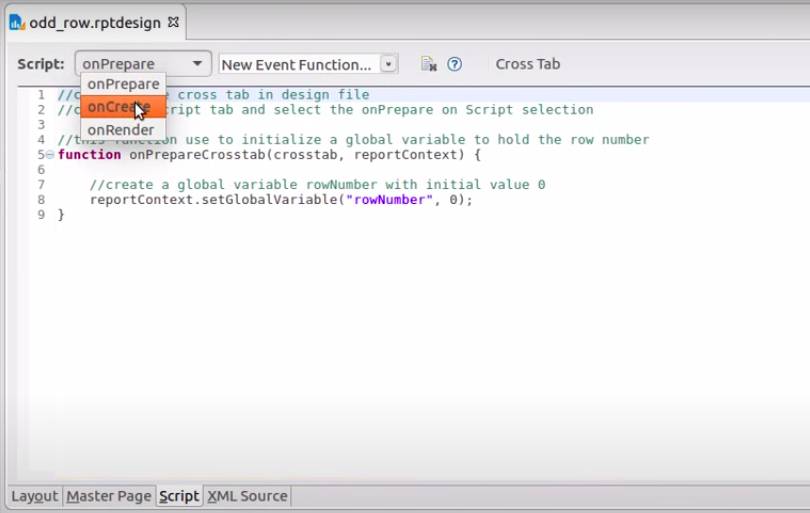
Click on onPrepare option as bellow.
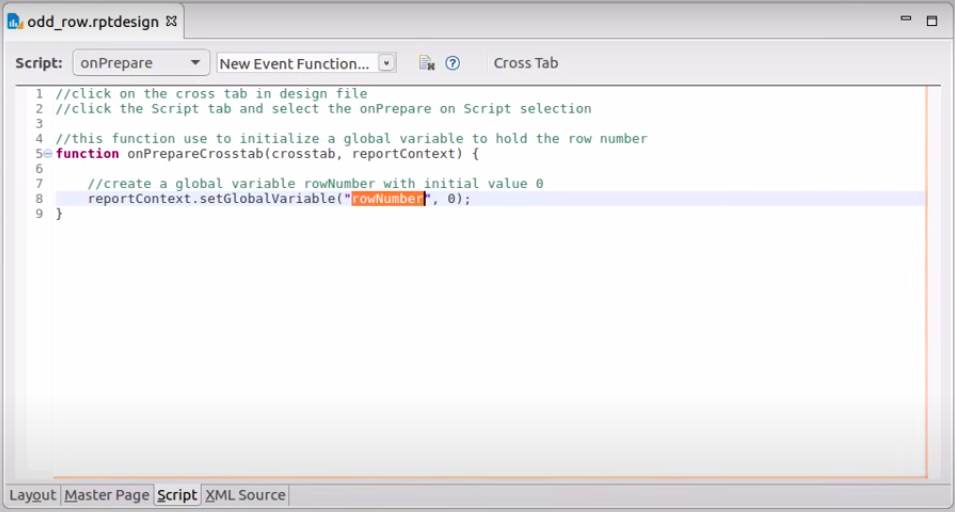
Here we are going to create a global variable. This variable will be created and initialized while preparing the BIRT report.
    //click on the cross tab in design file
    //click the Script tab and select the onPrepare on Script selection

    //this function use to initialize a global variable to hold the row number
    function onPrepareCrosstab(crosstab, reportContext) {

    	//create a global variable rowNumber with initial value 0
    	reportContext.setGlobalVariable("rowNumber", 0);
    }
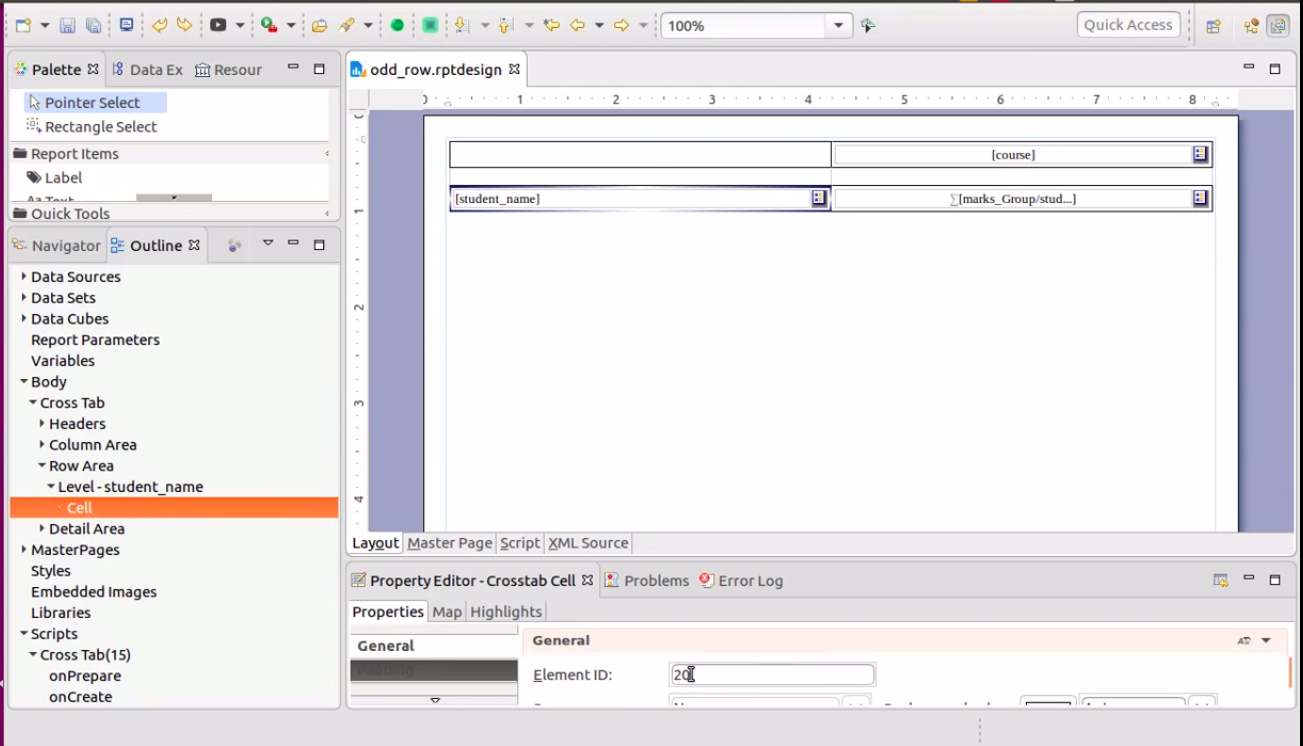
How to find BIRT crosstab cell id or element id ?
Click on the cell that you wish and go to the General section under Properties palette. Then you will be able to find element id from there.
Next, we are going to create another script for process the records during generating the rows of the BIRT crosstab report.
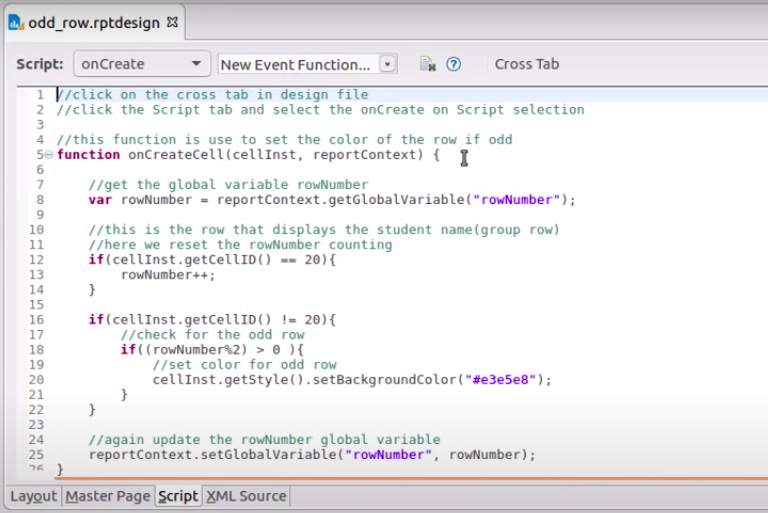
Click on the onCreate option.
In this example, we are not going to change the student name column colors. Here we are going to retrieve the global variable and check whether the row id is equal to the required group.
After that we are going to increment the global variable for each non student name group rows.
Then we are going to change the color for each odd row.
    //click on the cross tab in design file
    //click the Script tab and select the onCreate on Script selection
    //this function is use to set the color of the row if odd
    function onCreateCell(cellInst, reportContext) {
    	//get the global variable rowNumber
    	var rowNumber = reportContext.getGlobalVariable("rowNumber");
    	//this is the row that displays the student name(group row)
    	//here we reset the rowNumber counting
    	if(cellInst.getCellID() == 20){
    		rowNumber++;
    	}

    	if(cellInst.getCellID() != 20){
    		//check for the odd row
    		if((rowNumber%2) > 0 ){
    			//set color for odd row
    			cellInst.getStyle().setBackgroundColor("#e3e5e8");
    		}
    	}

    	//again update the rowNumber global variable
    	reportContext.setGlobalVariable("rowNumber", rowNumber);
    }
We are almost finished with this example. Click on the preview button to preview our final result.

The final preview of the report.
You can download the BIRT report design file from here.
For more information, check out our video.